ROAS
Learn what the ROAS chart measures and when to use it.
What it shows
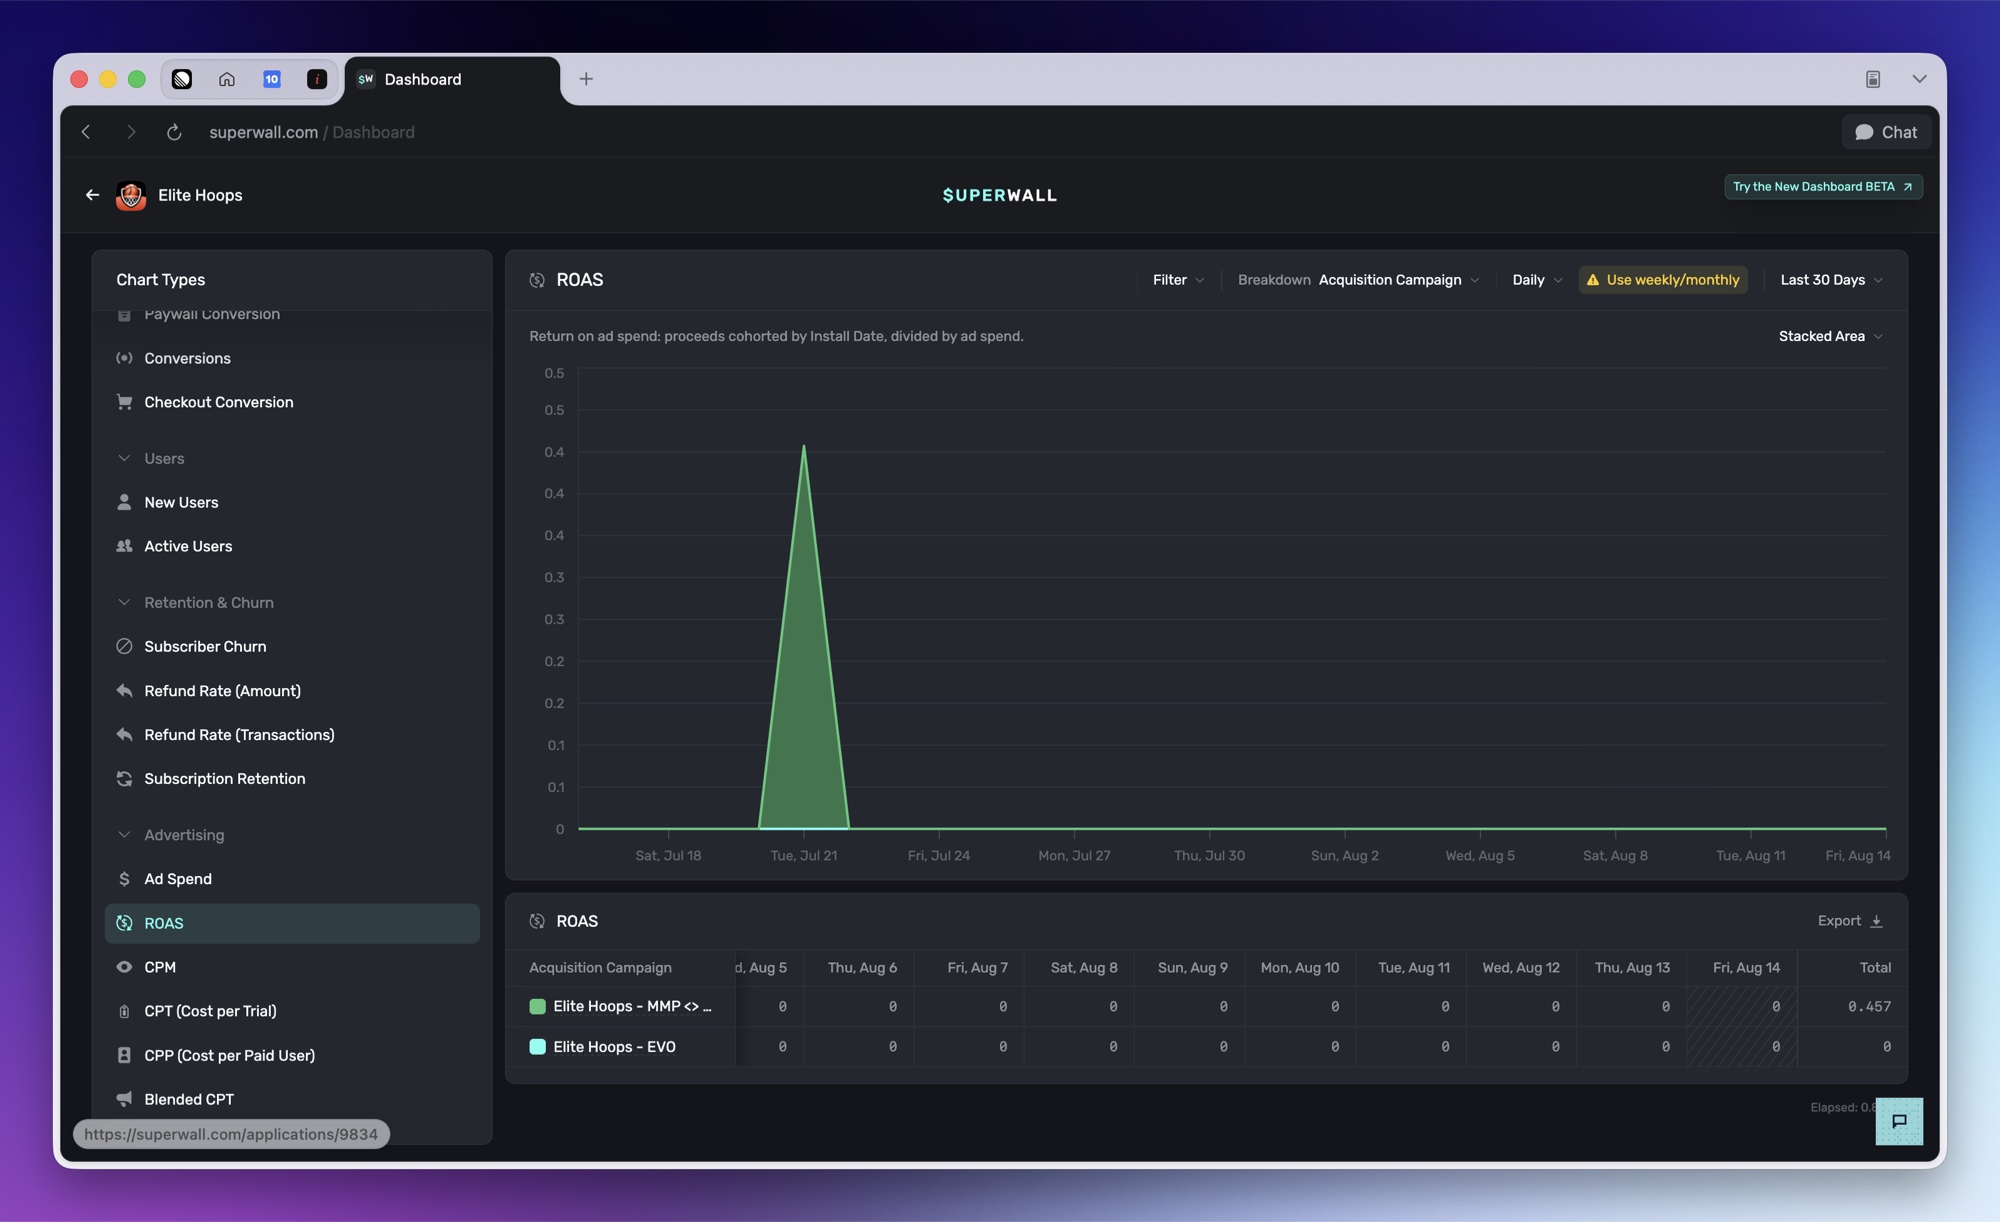
ROAS shows your return on ad spend: proceeds cohorted by install date, divided by ad spend.
How to use it
Break down by Acquisition Campaign to see which campaigns pay back. A value above 1 means a cohort has earned back more than it cost to acquire.
Good to know
ROAS defaults to an Acquisition Campaign breakdown so you can see which campaigns pay back. Without a breakdown it shows one blended figure across every network with ad spend, which hides how individual campaigns perform.
Because values are cohorted by install date, daily buckets read close to zero. The chart defaults to weekly intervals and warns you when Daily is selected.
Advertising charts appear once performance marketing is enabled for your app. See Meta Ads.
How is this guide?