Charts
CPM
Learn what the CPM chart measures and when to use it.
What it shows
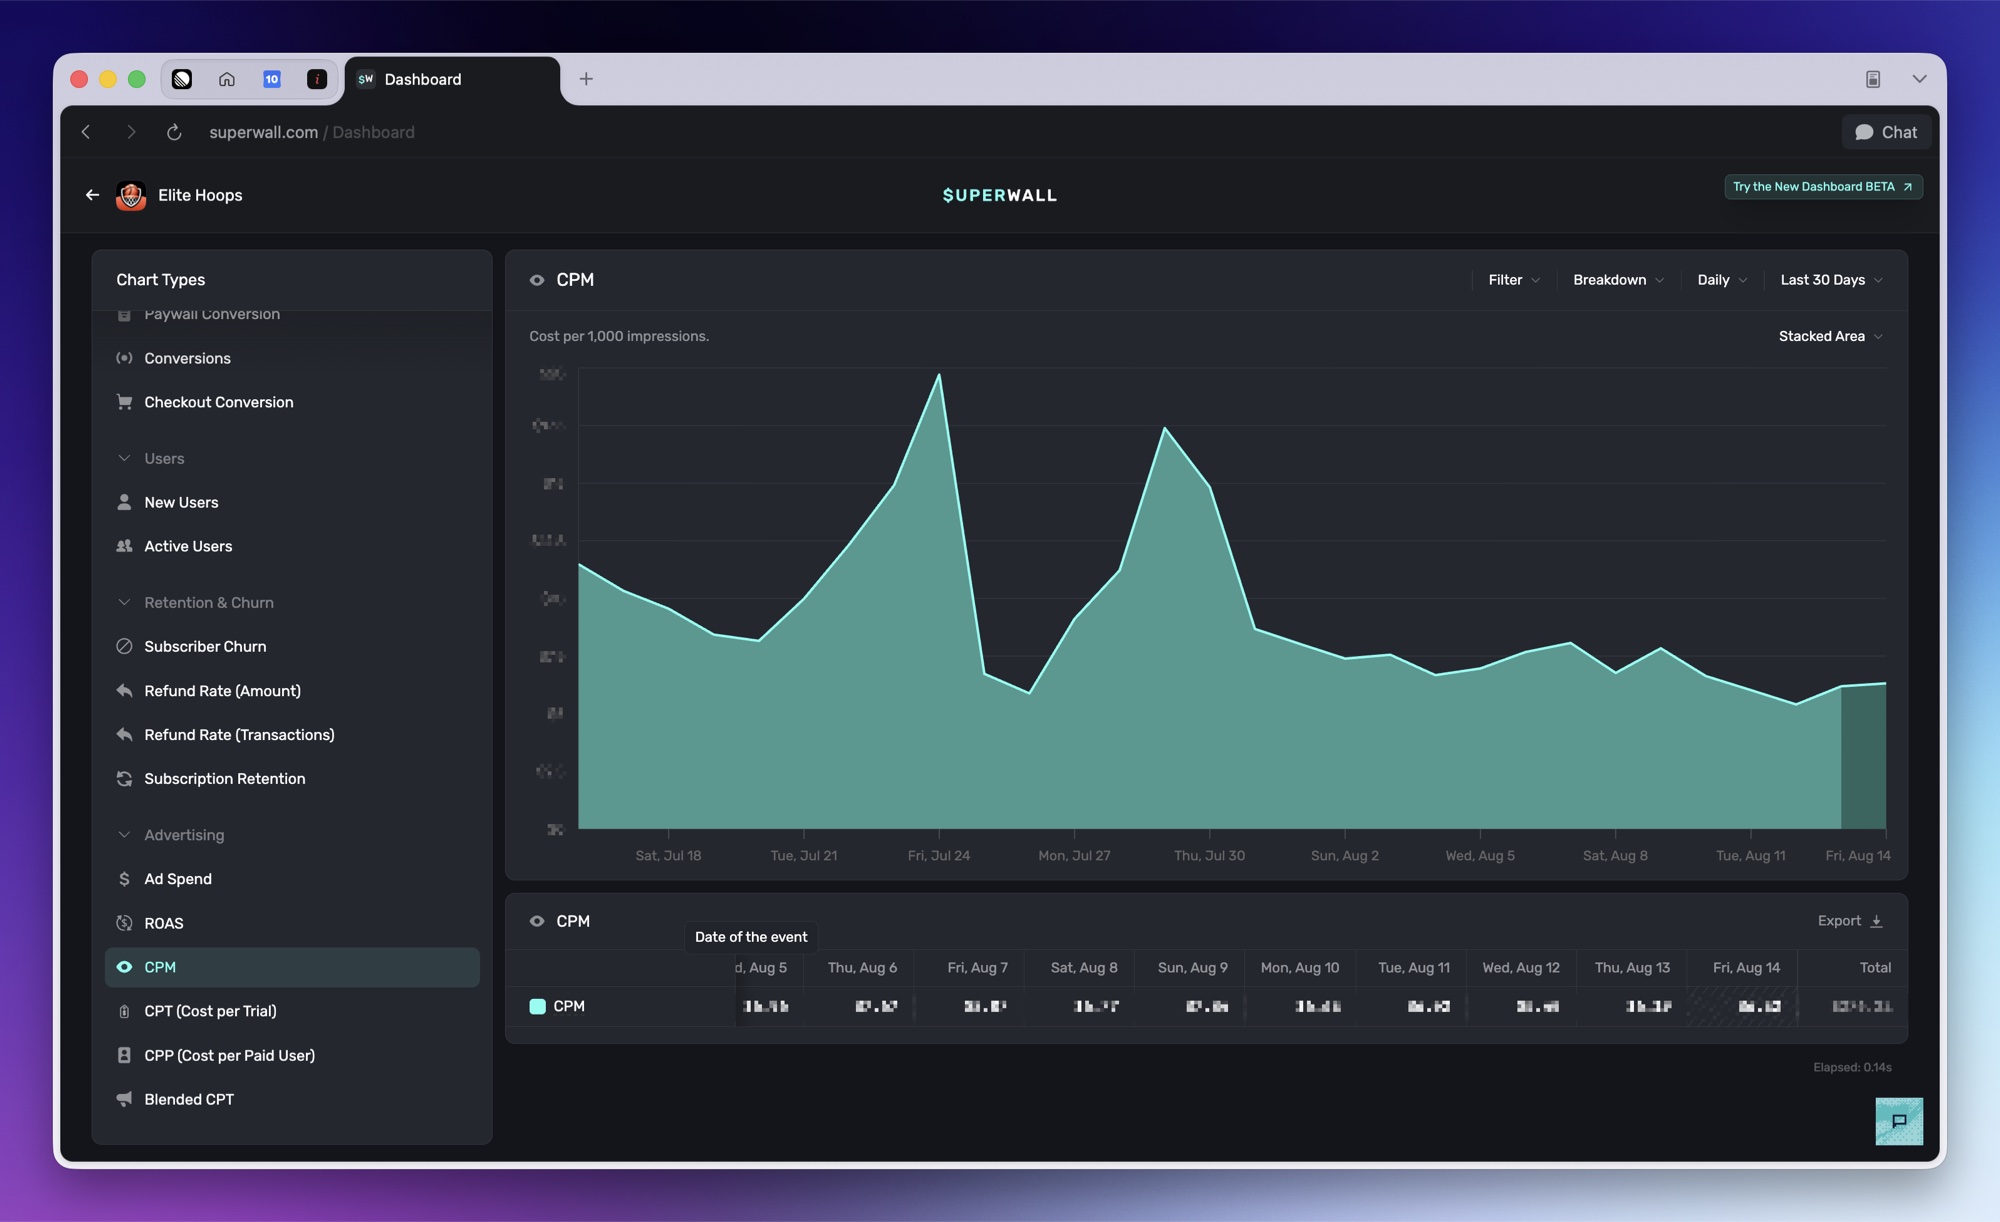
CPM shows your cost per 1,000 ad impressions, from the spend and impressions your connected ad accounts report.
How to use it
Monitor what reach costs over time and compare it across campaigns. A rising CPM with flat results means you're paying more for the same audience.
Good to know
CPM comes from spend and impressions alone. It doesn't depend on install attribution, so it works even for campaigns with no attributed installs yet.
Advertising charts appear once performance marketing is enabled for your app. See Meta Ads.
How is this guide?