Charts
Blended CPT
Learn what the Blended CPT chart measures and when to use it.
What it shows
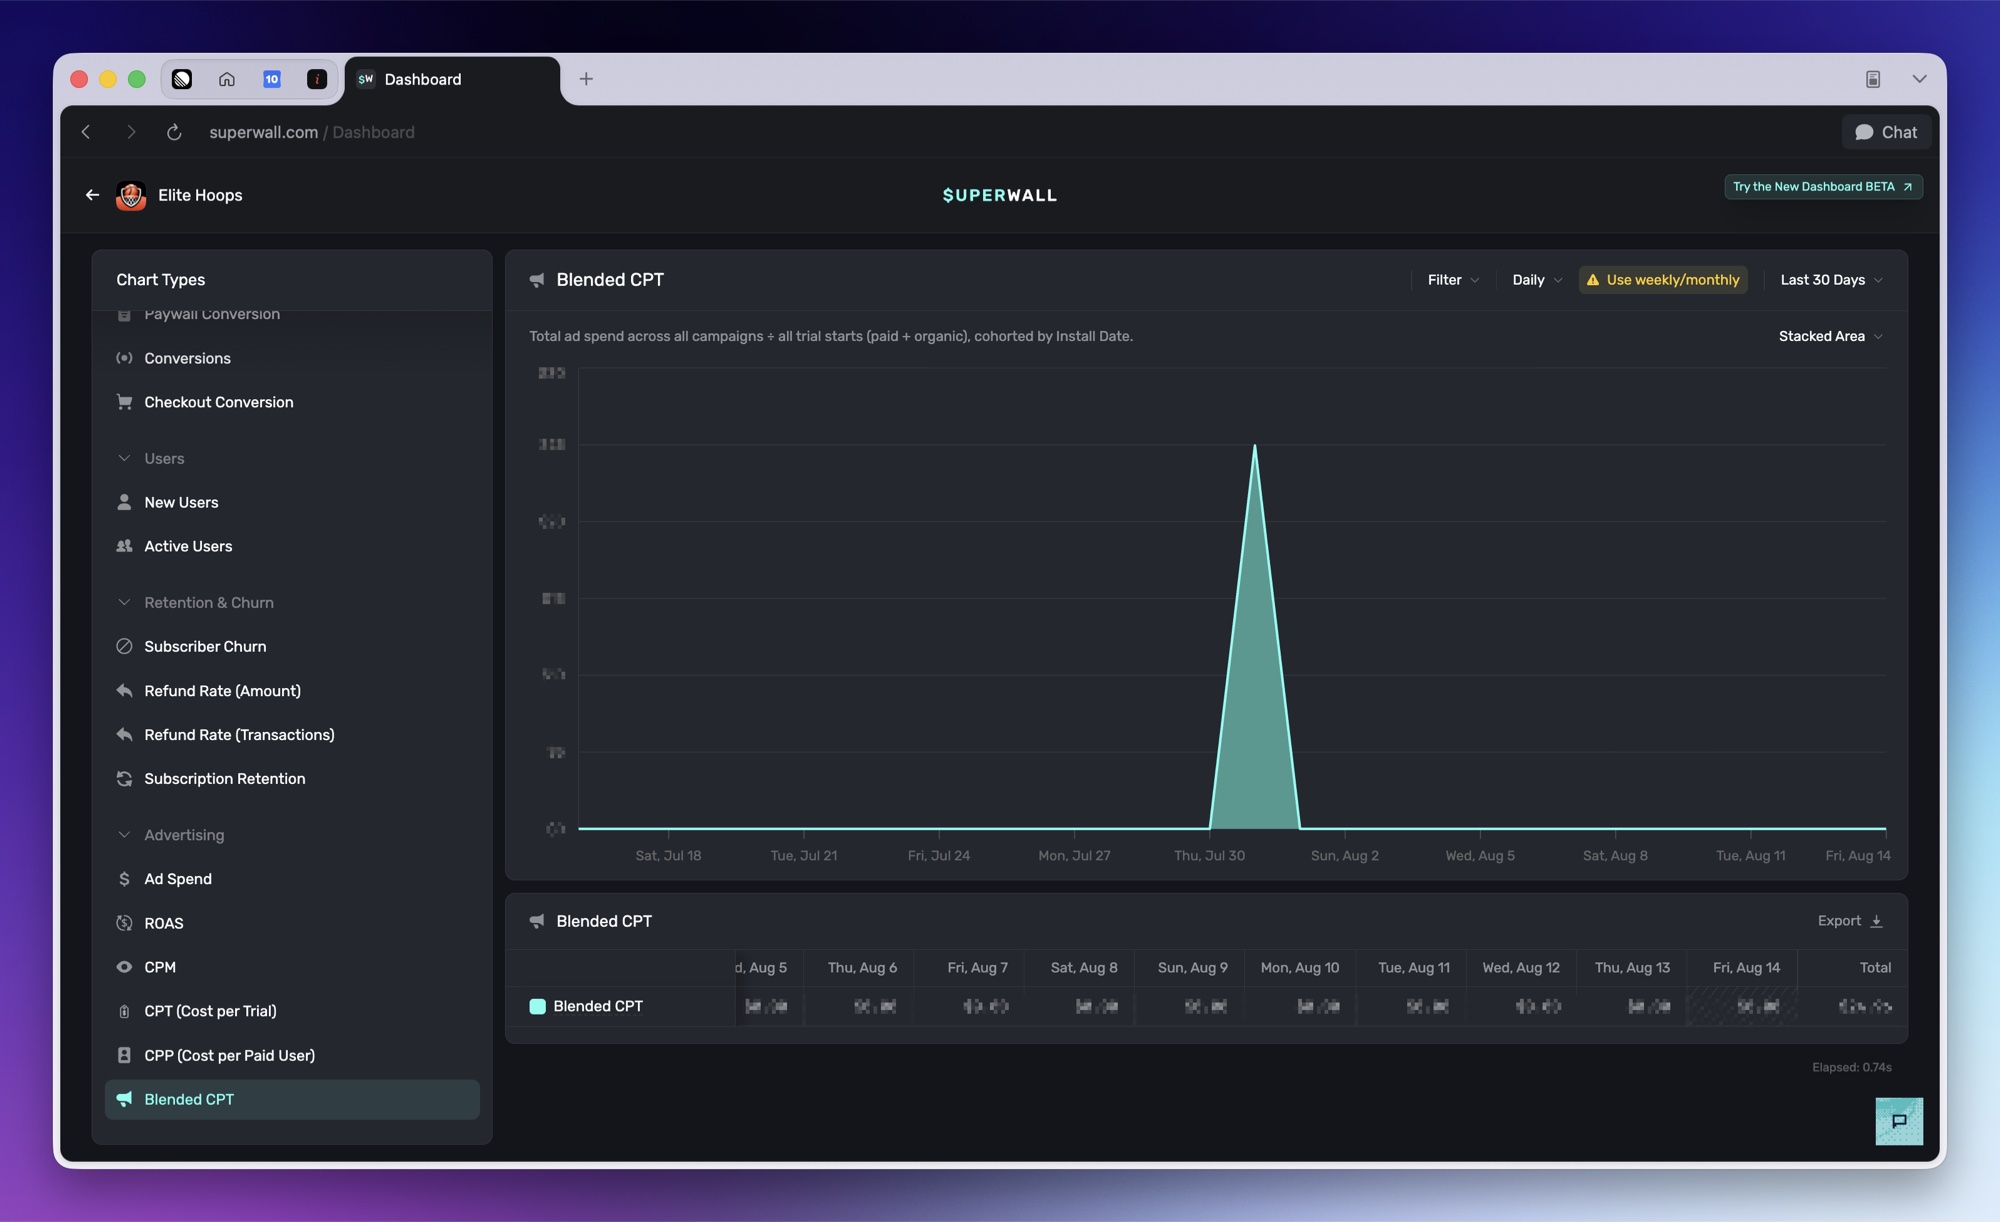
Blended CPT shows your total ad spend across all campaigns divided by all trial starts, paid and organic.
How to use it
Use it to see what a trial costs you overall, counting the organic trials that paid acquisition may also be driving.
Good to know
Blended CPT is a single blended figure and intentionally has no breakdown. Splitting it per campaign would turn it into plain CPT.
Because values are cohorted by install date, the chart defaults to weekly intervals.
Advertising charts appear once performance marketing is enabled for your app. See Meta Ads.
How is this guide?